
Bounce Rates
UX research study on Concordia University, St. Paul’s website bounce rates. I wondered if a page’s bounce rate is related to how recent that page was updated. Are pages that are updated less often promoting higher bounce rates?
What are bounce rates?
To begin, the concept of bounce rates needs to be understood. It is simple.
Bounce Rates: user enters web pages and leaves without taking other actions.
There are multiple forms of calculating bounce rates. It can be by the page, for the entire site, or within segmentations.
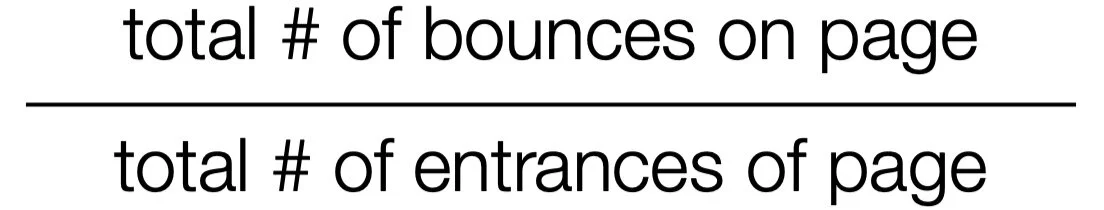
The simplest form is the total number of bounces on a page divided by the total number of entrances of that same page.
For this study, I took data from September 1, 2019 to November 25, 2019. This is the portion of the Fall 2019 semester till November 25th, the day I began this.
Bounce Rating

Here is a general ranking of bounce rates.
Out of the 18,426 pages that make up the CSP website, 922 pages have a recorded 100% bounce rate!
Good vs. Bad Bounces
A bounce is an action. There is a good action and a bad action. There is a good bounce and a bad bounce. Goal of our website is to get prospective students to apply and enroll in our institution. Typically blogs, new sites, event pages, thank you pages, etc should ideally have a high bounce rate because they are a single-page site. Meaning, they do not have a goal for visitor to venture further.
Good Bounce
Actions that are taken towards a purchase, or application, or in the direction the goal of the website.
Bad Bounce
Actions taken by user caused my lack of interest, confusion, or a bad experience, where they move farther from intended goal.
Starting the Study
To begin studying this, I will find 5 pages with 100% rate and take 5 similar pages with an excellent rate and compare their statistics, visual aspects, and other factors.
I focused on the program pages. I will pair one good and one bad bounce rate pages that are related by their area of study.
To gather data, I looked to our website’s google analytics. I recorded data from September 1st to November 25th of 2019 on each program page and exported it into an excel worksheet. I selected that time range to focus on data for the 2019 Fall semester.
Cleaning Data
Here is the collection of all the raw program page data. Within the yellow column describing bounce rates, I highlighted pages with a 100% bounce in red and highlighted pages with an excellent rate, 26-40%, in green. From there I took out those rows and separated them into their own tables with respect their their bounce rank.

These are the tables I organized to display the rates I am focusing on that have 20+ pageviews. Anything under 20 isn’t reliable, obviously, because the values are so low. From here, I matched up 10 pages to study their comparison.


Selecting Pages
Based on the tables above, I was able to pair up 5 topics easily. Math, Religion, Social, Health, and Writing.
100% Rate
Secondary Education Math Major
Religion Minor
Criminal Justice Minor
Gerontology Minor
Communications Studies Minor
26 - 40% Rate
BA - Math
Theology Major
Political Science
Forensic Mental Health Certificate
BA - English with Journalism Emphasis
This is was I am curious about:
Is there a correlation between a page’s bounce rate and that date it was updated on?
Why do the 26 - 40% bounce well while the other pages don’t?
Calculating Correlation
A correlation coefficient is a numerical measure of some type of statistical relationship between two variables.
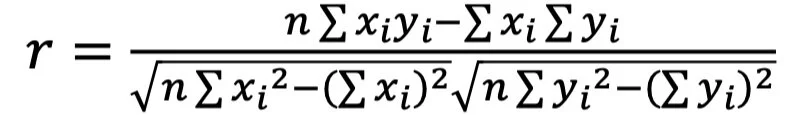
This is the formula I followed to solve for r, the Pearson Correlation, that measures a linear dependence between x and y. In this case, date and bounce rate.
Below is a display of the calculation steps I did in excel.
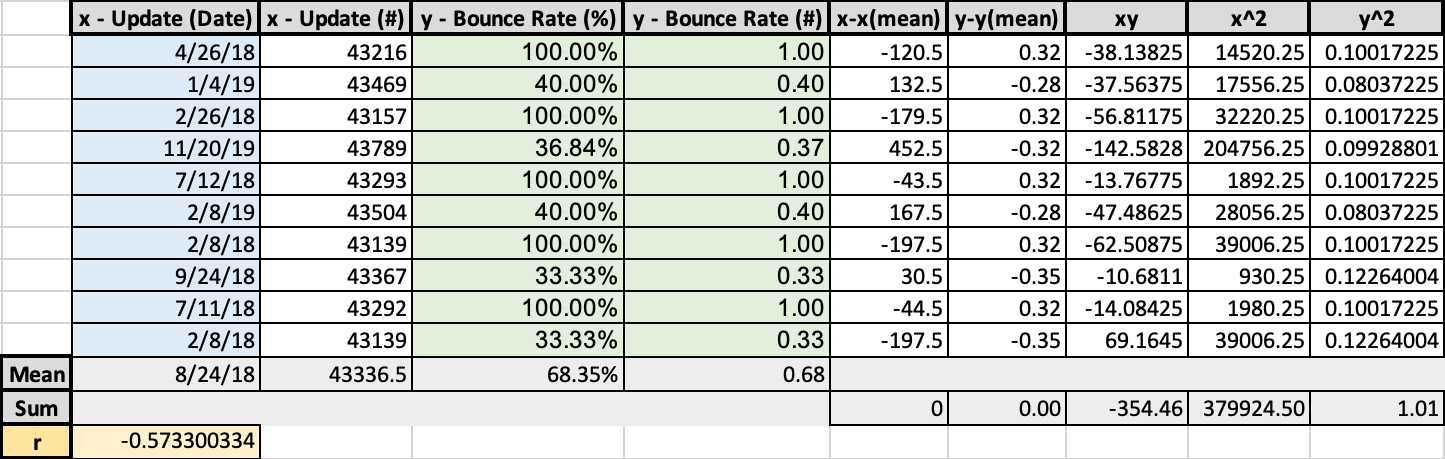
I first converted the dates into number formats and change the percentages into decimals. I then was able to calculate each mean, find the difference between each variable, perform multiplication, and total the sums.
Plugging in all the results into our equation, the answer displays r = -0.573.
On the spectrum from -1, being a negative correlation, to 0, no correlation at all, to 1, a positive correlation, we have a relationship that leans negative. Meaning, one variable increases while the other variable decreases. In this case, as the date of a page’s last update increases, it’s bounce rate decreases!

This graph shows the relationship of the date increasing while the bounce rate is decreasing. You can see in the graph that I included the y-forumla to showcase the rate of which the variables are changing together by the slope and y-intercept.
R^2, read “r squared”, is the variable used to represent a statistical measurement representing the variance of the dependent variable explained by the independent variable in a regression model.
Variance implies the average of the squared differences from the mean.
Regression Model is a set of statistical processes for estimating the relationships between variables.
Yes, there is a correlation but how are the pages performing? I examined the google analytics.
Web Page Data & Factors
Average Load Time

From September 1st to November 25th, there was an average of 590 CSP web page visitors per day. Who, on average, had to wait 5.57 seconds for a page to load.
5.57 seconds. That is a lot considering the average user only waits 3 seconds before leaving site to view a competitor. Anything more than 3 seconds causes frustration and makes the visitor exit the page increasing the bounce rate.
But, who is waiting for us? Who are our users and what are they accessing us with?
User Demographics
User Age

This table displays our users by age. These two categories, by far, documented higher values of users compared to other age groups.
25 - 34: 25 - 34 year olds make up about 800 out of the 3,127 Fall 2019 CSP undergrads. This age of web users typically are seeking degree completion or to explore Masters level programs. Notice majority of this group is new compared to returning. That shows 77% of 25 - 34 year olds do not visit our website again.
18 - 24: 18 - 24 years olds are the traditional perspective, college-aged students. Compared to the other group, 18 - 24 year olds return to site more. These are most likely current students.
User Devices
Desktop: 55% Vistors; 54% Bounce Rate; 43,607 Chrome; 30,039 Safari
Mobile: 42% Visitors; 60% Bounce Rate; 25,838 Apple iPhone; 2,911 Apple iPad
The turnout between desktop vs. mobile is about equal. There is a 60% bounce rate for mobile users most likely because the screen space is limited, that is not as easy to organize flow and thought compared to the larger viewing offered from desktops.
CSP seems like to favor Apple. Although we follow google platforms, the majority of people’s experiences are through Apple’s products and brower.
This is important to consider because users bounce and provide data from whatever device they are using at that moment. Desktop and mobile offer different perspectives and opportunities in experience.
What Makes the Good, Good? What Makes the Bad, Bad?
What makes the pages with a bounce rate of 26 - 40% have that rate while similar pages have a 100% bounce?
Math Pages
BA - Mathematics
Last Update: 1/4/19
Bounce Rate: 40%
User Next Action: 40% Academics; 18% BS - Mathematics
Secondary Education Math Major
Last Update: 4/26/18
Bounce Rate: 100%
User Next Action: 22% Academics; 24% Admissions; 7% Dr. Krueger; 7% Dr. Jahn
In comparing the math pages, these programs both offer lots of content and areas to explore further.
Good:
Good use of white space, which help promote balance, user focus increases by 20% just because the ability to have headings and text stand out. The white space is fresh, modern, and open.
Next Action is frequently to the admissions page which leads to 18% to the application page.
Showcasing faculty allows users to learn and get to know their potential educators. Visitors advance in that direction, when available.
Bad:
Admissions link leads to an error page.
Negative white space - user is shown blank, empty space where useful information could be portrayed.
Long - especially on mobile preview
Religion Pages
Theology Major
Last Update: 11/20/19
Bounce Rate: 37%
User Next Actions: 16% Academics; 16% Academics; 9% Koschmann; 8% Deressa; 8% M. Schuler; 8% R. Schuler
Religious Minor
Last Update: 2/26/18
Bounce Rate: 100%
User Next Actions: 36% Academics
Good:
People are interested in the faculty! Especially in theology because religion is a close, personal connection.
Bad:
Mobile version - Due to a phone’s limited real estate, the first sight the user expereincesis a picture of a window.
Mobile version - Very long
No featured faculty
34% Exit Rate
Social Pages
Political Science Minor
Last Update: 9/24/18
Bounce Rate: 33%
User Next Actions: 24% Academics; 15% Admissions
Criminal Justice Minor
Last Update: 2/8/18
Bounce Rate: 100%
User Next Actions: 38% Academics; 19% Admissions
Good:
Clean white space, again visually appealing and results in a trustworthy connection with webpage and therefore organization.
User is spending 2 and a half minutes on this page - shows interests before moving on. They must be reading word-for-word instead of skimming content.
Admission to 18% Application page
2.32 second load time
Bad:
As it seems users are interested in learning about the faculty, these pages offer no opportunity to do that.
No related programs showcased.
Health Pages
Forensic Mental Health Certificate
Last Update: 2/8/18
Bounce Rate: 33%
User Previous Actions: 27% “forensic” Search
User Next Actions: 80% Admissions
Gerontology Minor
Last Update: 7/11/18
Bounce Rate: 100%
User Next Actions: 47% Academics
Good:
Load time is 1.39 seconds but because there is unfortunately no content.
Bad:
Not presenting anything to user and asking too much of them.
No faculty, again.
Writing Pages
BA - English with Journalism Emphasis
Last Update: 2/8/19
Bounce Rate: 40%
User Next Actions: 38% Admissions; 21% Academics
Communication Studies Minor
Last Update: 7/12/18
Bounce Rate: 100%
User Next Actions: 50% Academics
Good:
Best page performance: BA - English with Journalism Emphasis
Leads to admissions most of the time
Fast load time (1.74 sec)
Includes faculty and related programs
Happy hero image - girl laughing
Bad:
Imperfections are unprofessional and interpreted as untrustworthy by the user and there interpret our institution as untrustworthy.
Communication Studies Minor has a long load time (3.68 sec)
The best performing page was the BA - English with a Journalism Emphasis which was last touched on February 8th, 2019. The most recent updated page was Theology Major page in November. Both performed well but, they were updated at very difference times.
What they both had was their content and visual layout. Both included program explanations, related programs, faculty, good white space, and both lead users to view the admissions page. The users were interested and explored further in the goal of our website - that is a good bounce.
What can we do with this?
Encourage departments to include more content such as inserting faculty profile links and showcase related programs because CSP web page visitors do show interest in the educators and similar programs. It would also be important to frequently update pages to clean up and add new information.
The marketing department, and all departments, can use this to determine whether or not they are meeting their user’s expectations. This information can also be used to make informed desicions regarding content marketing, paid acquisition, SEO, and CRO or user experience.
Resources & References
csp.edu (in reference with google analytics)
CSP enrollment data
https://www.searchenginejournal.com/what-is-bounce-rate-how-to-audit/240555/#close
https://www.digishuffle.com/blogs/10-ways-to-analyze-high-bounce-rate-advanced-guide/
https://www.gorocketfuel.com/the-rocket-blog/whats-the-average-bounce-rate-in-google-analytics/
https://www.socialmediatoday.com/content/web-design-11-characteristics-user-friendly-website
https://blog.hubspot.com/marketing/improve-your-websites-user-experience
https://www.oho.com/blog/2019-google-analytics-benchmarks-higher-education-websites
https://www.broadbandsearch.net/blog/mobile-desktop-internet-usage-statistics
https://www.dotnetcatch.com/2017/07/14/zeros-in-google-analytics-site-speed-metrics/
https://iop.harvard.edu/survey/details/demographic-and-political-profile
https://ezgif.com/effects/ezgif-6-a7142680d0de.gif (tool used)
https://screenshot.guru (tool used)
Larsen, Richard J., and Morris L. Marx. An Introduction to Mathematical Statistics and Its Applications. 5th ed. Boston: Prentice Hall, 2012.